
Google Looker Studio (formerly Data Studio) is a free, online tool that allows users to transform their data into informative, visual, and easy-to-read reports and dashboards.
This helps marketers and agencies gain deeper insights into the performance of their marketing campaigns and strategies, as well as share interactive data with clients and team members.
The main benefits of the Google Looker Studio (GLS) tool are:
- User-friendly: Intuitive, drag-and-drop interface.
- Multiple integrations: Connects with Google Analytics, BigQuery, and more.
- Real-time insights: Live dashboards for up-to-date data.
- Collaboration: Share and work on reports with your team.
- Customizable reports: Create interactive, tailored reports.
The Mangools SERPWatcher Looker Studio connector can help you integrate rank-tracking data from our SERPWatcher tool directly into your GLS account and create visual reports about organic rankings of your website in Google Search, along with multiple useful SEO metrics.
Tip: If you’d like to learn more about GLS data connectors and sources, make sure to check out the official Google documentation.
How to activate the Mangools SERPWatcher GLS connector
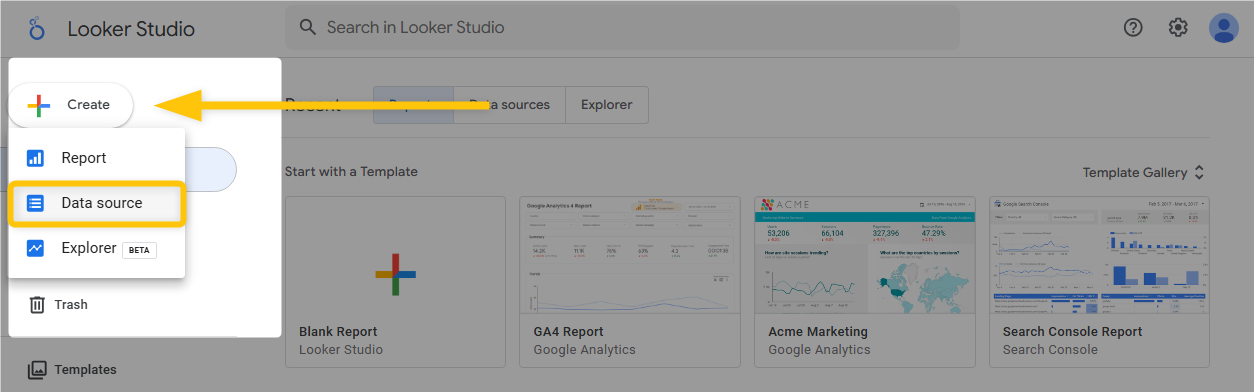
1. To activate the Mangools SERPWatcher connector for Looker Studio, log in to your Looker Studio account and create a new Data Source.
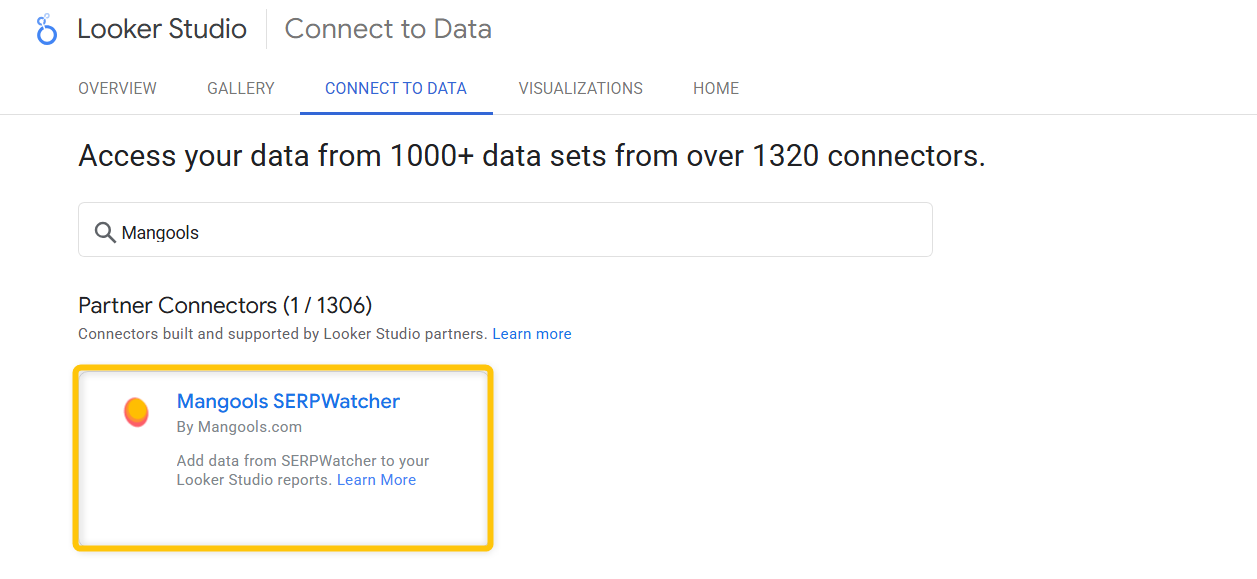
2. In the “Connect to data” section, search for and select the Mangools SERPWatcher connector.
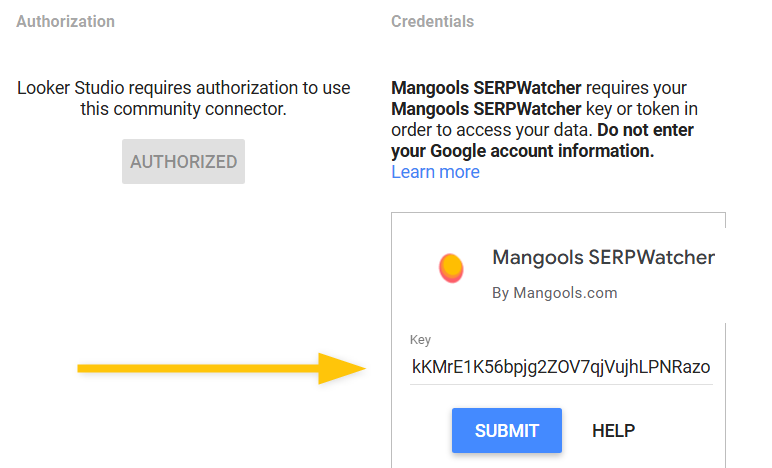
3. Click the “AUTHORIZE” button and allow Mangools to connect to your Google account.
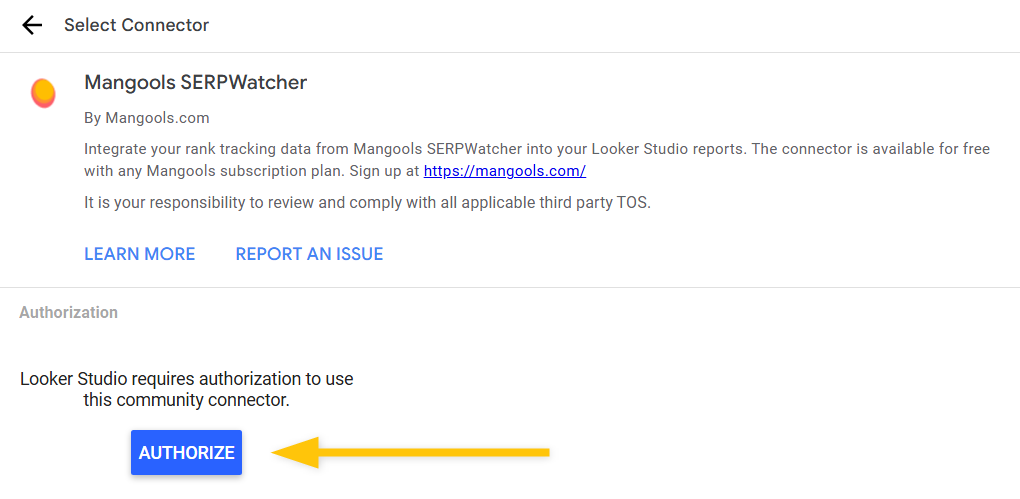
To connect your Mangools SERPWatcher account with the Mangools SERPWatcher Looker Studio connector, you need to enter a unique token from your Mangools account.
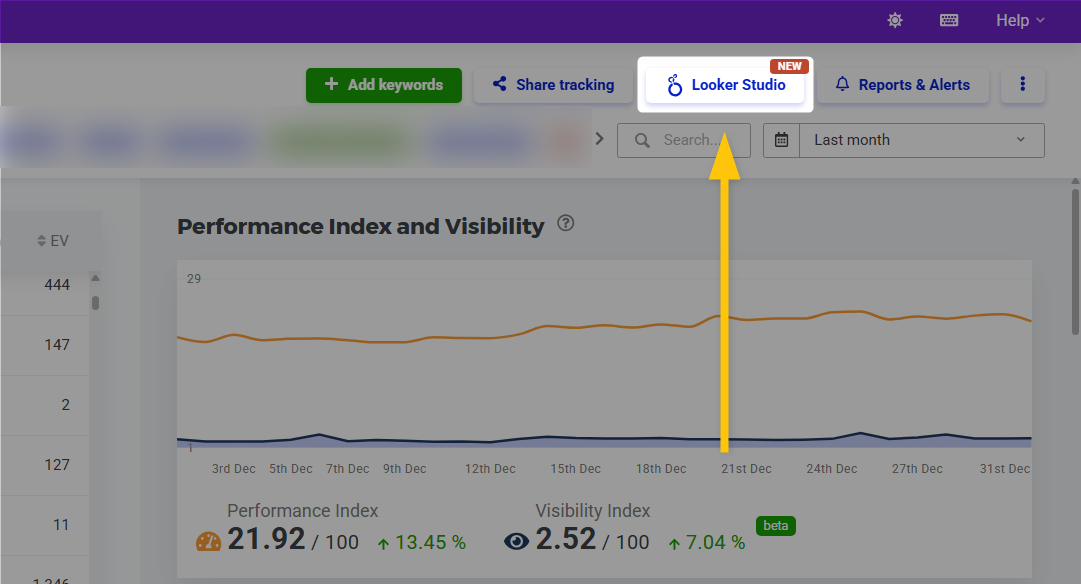
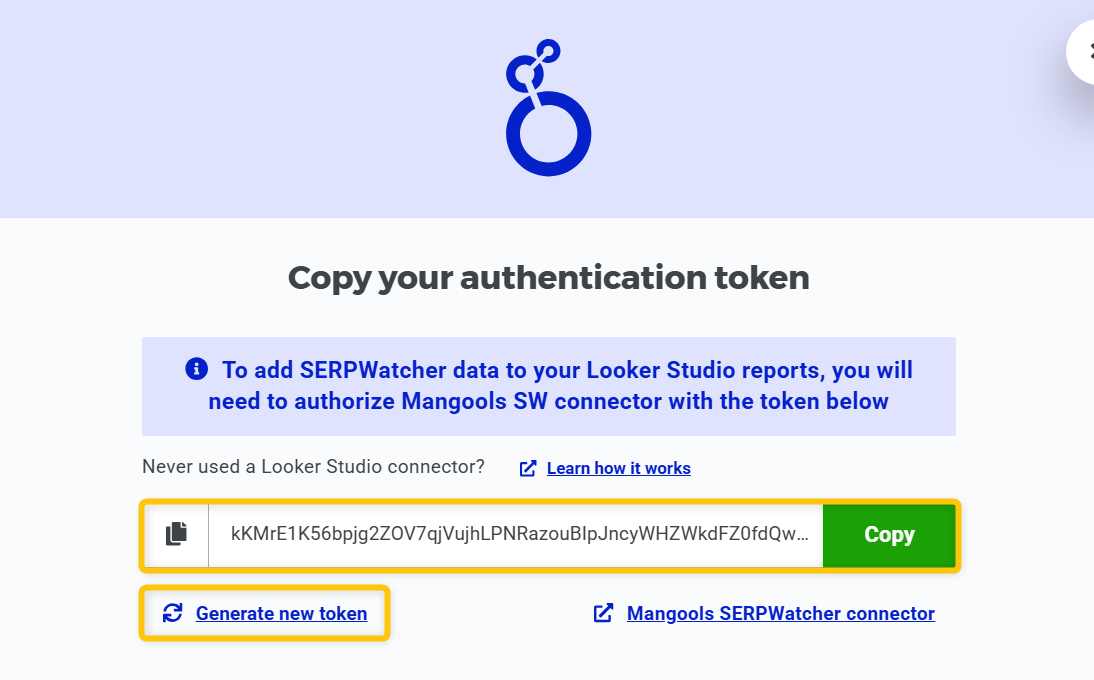
4. Go to your Mangools account → SERPWatcher → open the rank tracking report you want to connect → click the “Looker Studio” button at the top of the dashboard.
5. Generate and copy your unique token for the Mangools SERPWatcher Looker Studio connector.
6. Paste your token into the Mangools SERPWatcher connector in Looker Studio under the “Credentials” section and then submit it.
Your SERPWatcher account will now be connected to the Mangools SERPWatcher Looker Studio connector.
In order to integrate your rank tracking data from SERPWatcher into Looker Studio reports, you also need to add the Tracking ID from your SERPWatcher tracking URL into the Mangools connector in Looker Studio.
7. Open the SERPWatcher tracking you want to use for your Looker Studio report and copy the Tracking ID from the URL.
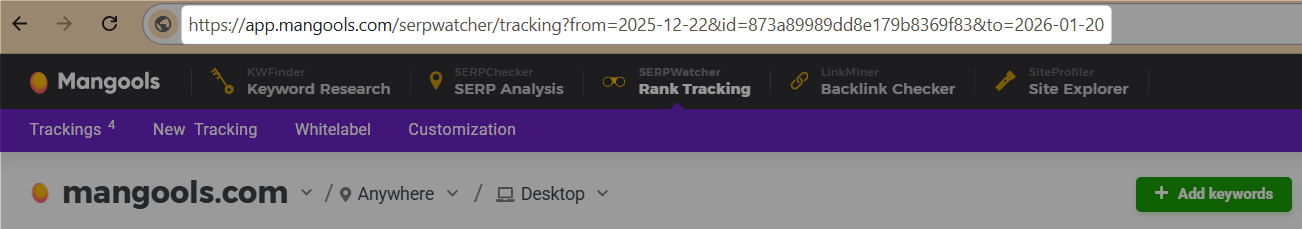
So for example, if your SERPWatcher tracking URL looks like this:
https://app.mangools.com/serpwatcher/tracking?from=2025-12-01&id=873a89989dd8e179b8369f83&to=2025-12-31
The tracking ID from the URL will be:
873a89989dd8e179b8369f83
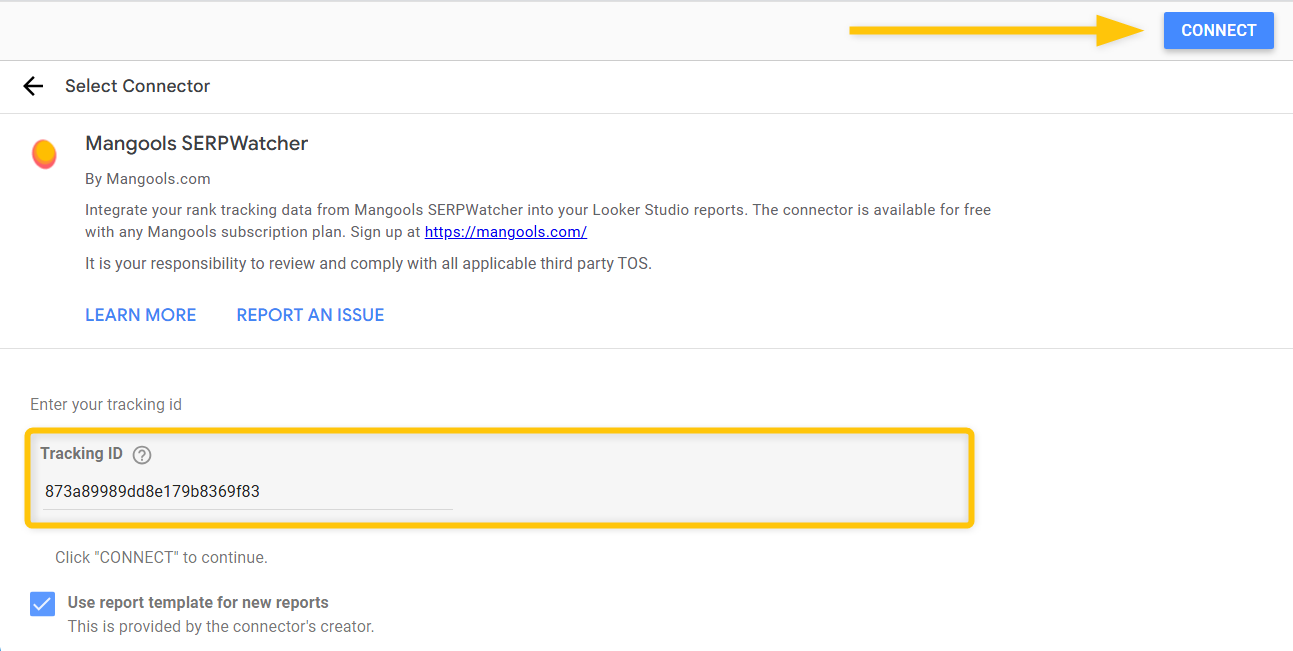
8. Enter the Tracking ID into the Mangools SERPWatcher Looker Studio connector, then click the “CONNECT” button at the top of Looker Studio.
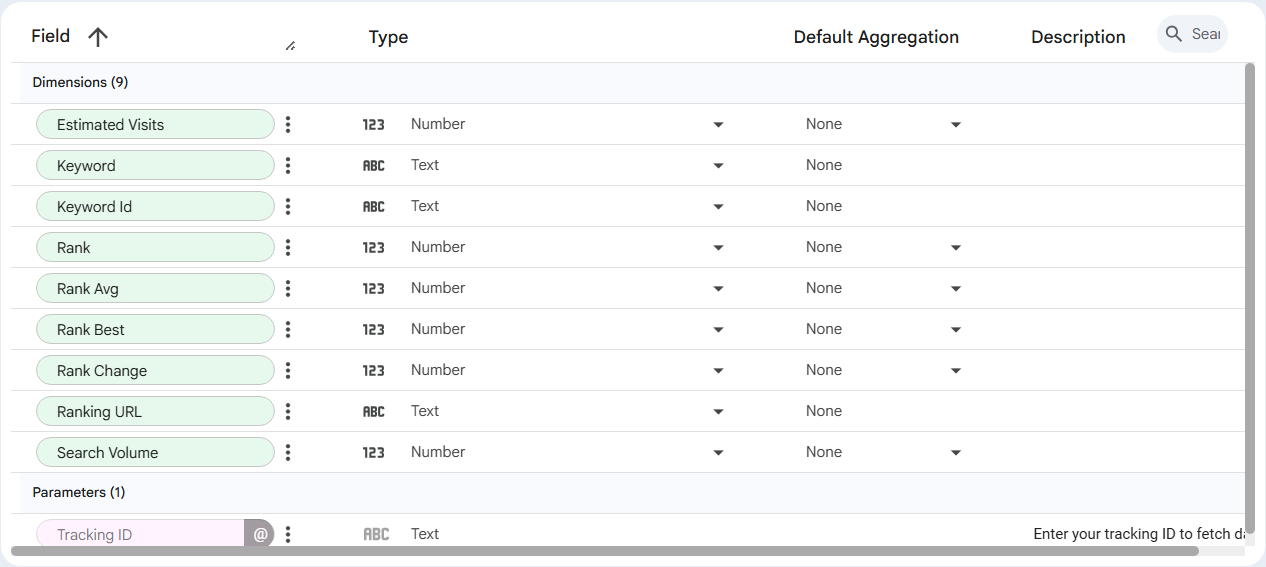
After that, the Mangools SERPWatcher connector will display all available fields, dimensions, and data types you can use (or adjust) for your Looker Studio rank tracking reports, along with settings such as credentials and data freshness.
9. Click “Create Report” at the top of Looker Studio, then select “CREATE REPORT” in the modal window.
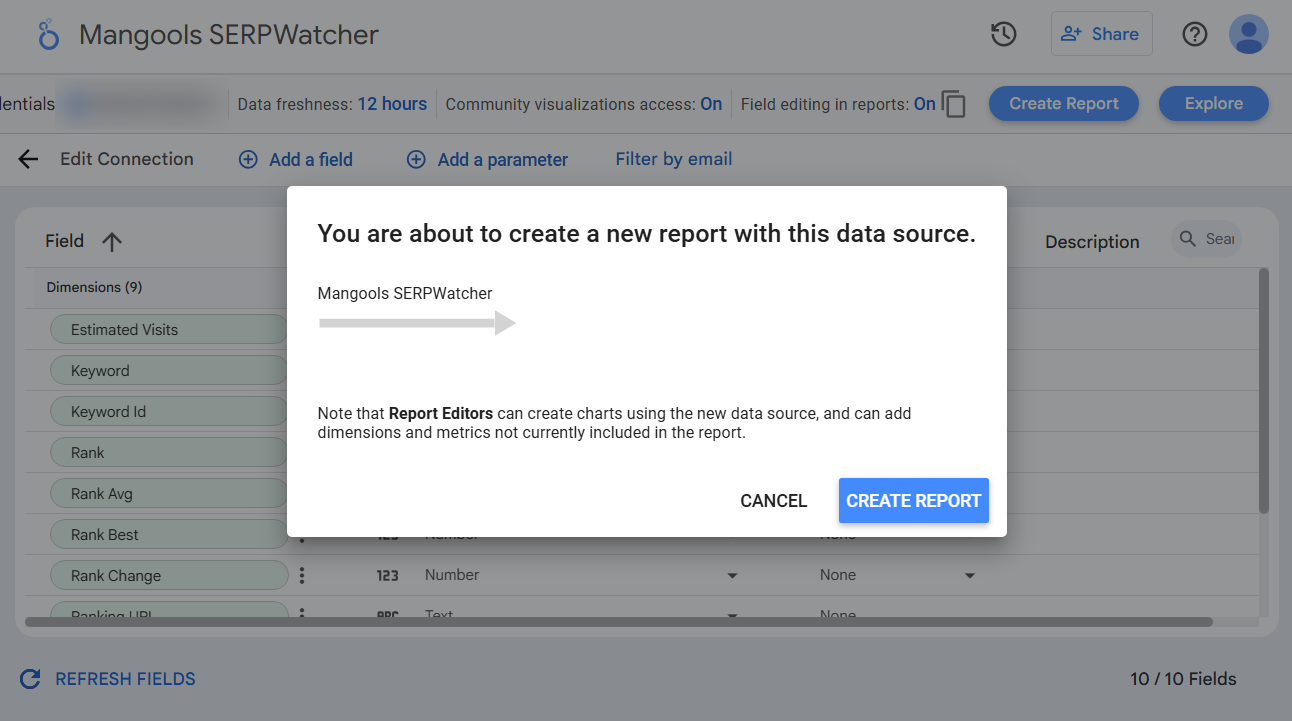
Mangools will fetch your SERPWatcher rank tracking data directly into Looker Studio, and you’re all set!
Available parameters and metrics
You can use multiple parameters to create custom reports and dashboards for your project:
- Keyword and Keyword ID – The search query (or list of queries) you are tracking in your SERPWatcher project for your website.
- Estimated Visits – Estimated organic traffic coming to your web page per month based on your current ranking position and search volume of the keyword in Google SERP.
- Rank – The position of the ranking URL for the tracked keyword in the Google SERP.
- Rank Avg – average ranking position of the URL for the given keyword over the selected time period.
- Rank Best – Best achieved ranking position of the ranking URL during the selected time frame.
- Rank Change – The change in the ranking position of the URL over the selected time period.
- Ranking URL – The web page that is ranking in Google for the tracked keyword.
- Search Volume – The average search volume of the keyword over the last 12 months.
Tip: If you’d like to learn more about creating and customizing GLS reports, be sure to check out this official Looker Studio guide.
Available Mangools SERPWatcher Looker Studio template
Our Mangools SERPWatcher connector provides a default template that you can use for your Looker Studio reports or customize based on the metrics and parameters you want to include in your SERPWatcher rank tracking dashboards.
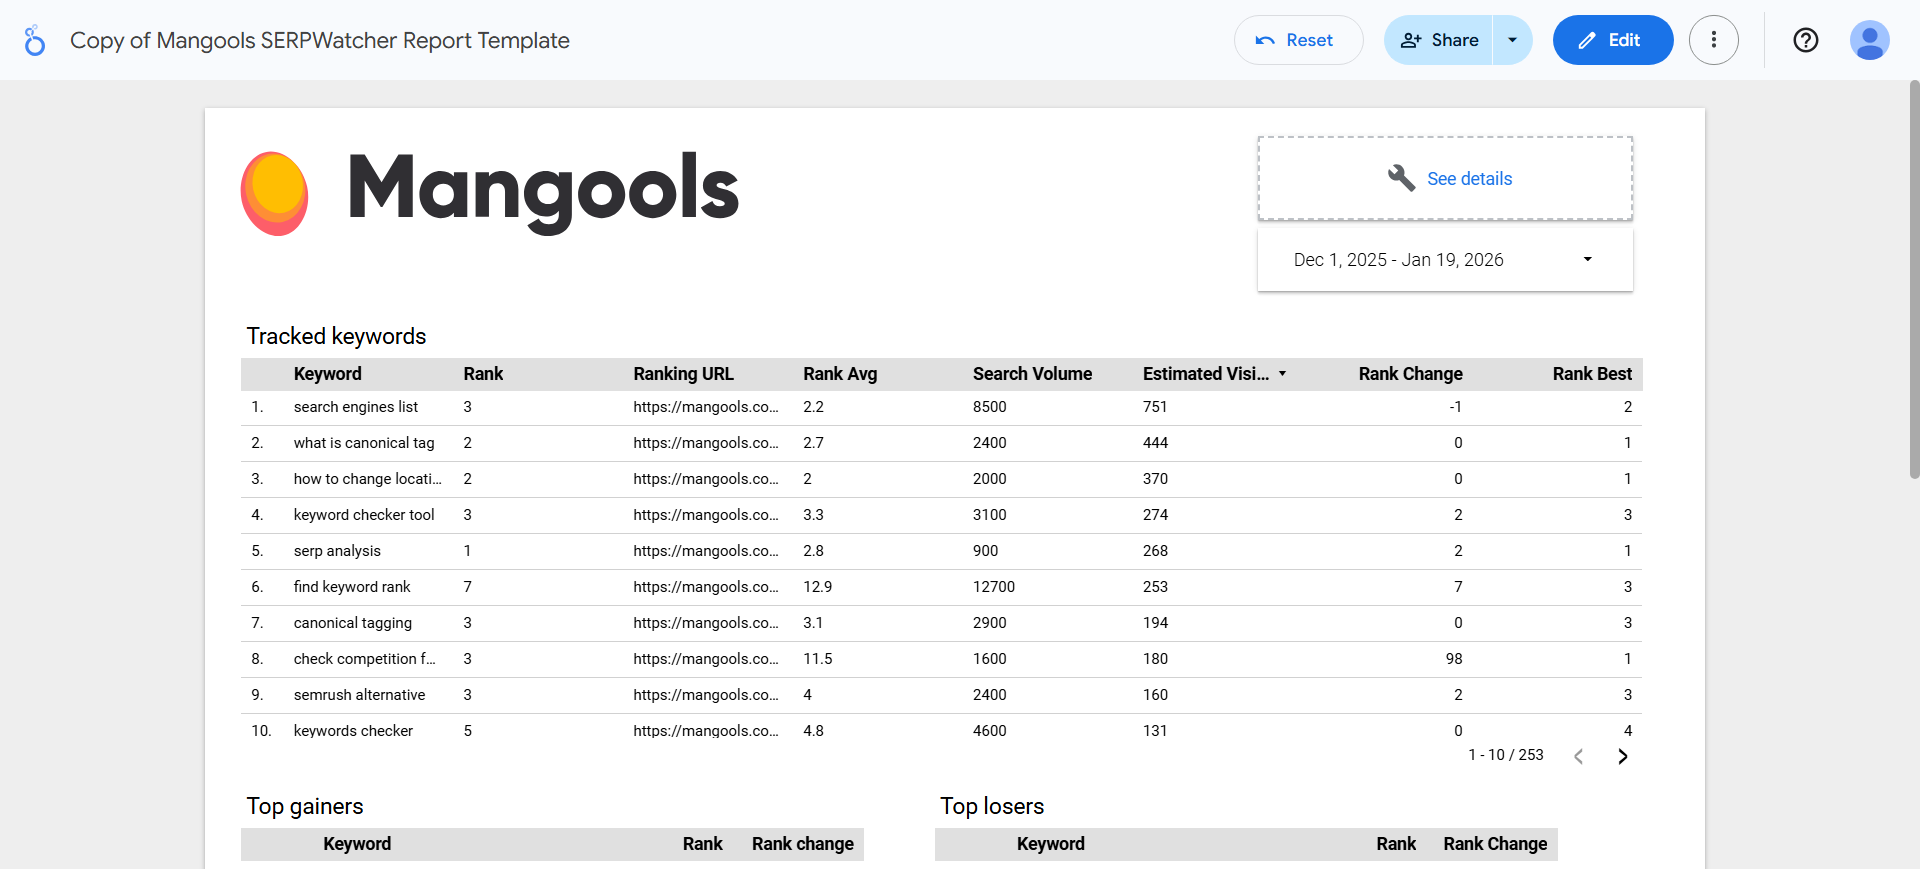
By default, the template includes:
- Tracked keywords overview – A table showing a detailed overview of all tracked keywords along with their search volumes, current ranking positions, ranking changes, estimated visits, etc.
- Top gainers – A table showing the keywords that have improved the most in terms of ranking positions and/or ranking changes.
- Top losers – A table showing the keywords that have declined the most in terms of ranking positions and/or ranking changes.
- Keyword position distribution – A table showing the number/proportion of tracked keywords for which you are ranking in the 1st, 2nd, 3rd, 4th positions, etc.
